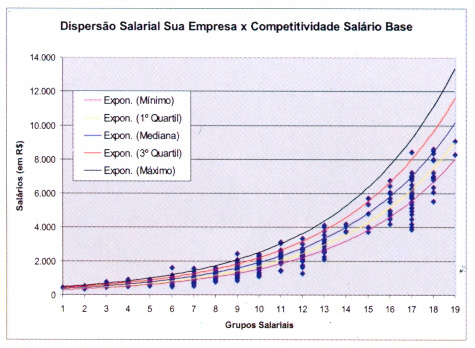
Salary Survey: More and more companies are looking for tools to assist in the process of administering the employee’s compensation.
Salary and Benefits Surveys are undoubtedly basic tools to generate reliable information, helping organizations in this difficult process.
Outsourcing surveys provides savings of time and personnel to the requesting company, without considering that the consulting know-how and exemption, gives more credibility to the survey.
BOZZA offers Salary and Benefits Surveys allowing your company to know the actual position of your policy and salaries practices in relation to the market, analyzing the composition of their compensation and benefits in order to effectively manage the internal consistency and external competitiveness.
 |
 |
- Hierarchical Structure;
- Position in Organization Chart;
- Base Salary and Variable Pay (commission, prizes, bonuses, profit sharing, etc.);
- Benefits (qualitative and quantitative);
- Monetary responsibilities.
- Types of Compensation
- Base Salary (Nominal Salary + Overtime + Media Variable);
- Total Cash (Base Salary + Bonus + Profit Sharing – PLR + Gain Sharing and other bonuses);
- Fixed Remuneration (Base Salary + Benefits);
- Total Remuneration (Total Cash + Benefits)
- Direct Remuneration (Total Remuneration + Stock Options)
 +55 11 99169-4224